Running the high country of Wyoming in the ever-growing popular pastime of shed hunting presents a plethora of opportunities for sportsmen and women. It’s an opportunity to stretch the legs, expand the lungs, and re-introduce your body to “mountain shape.”
It’s also a prime time to spot and observe wildlife herds – see firsthand the impacts the previous winter had.
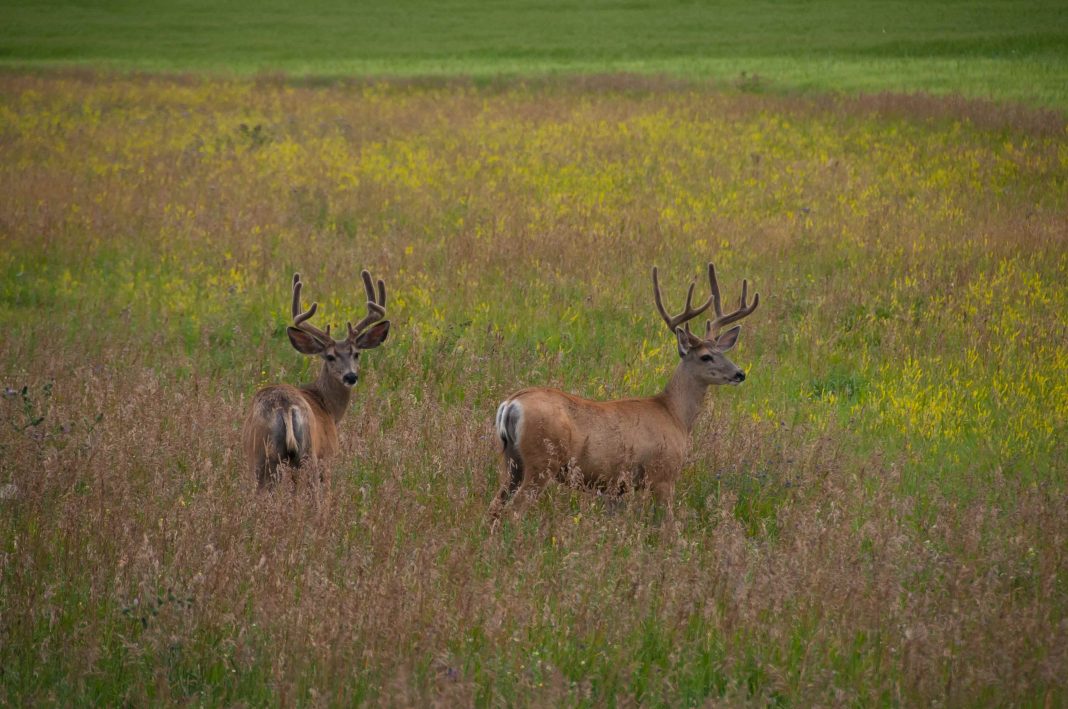
Folks shed hunting the Sheridan Region of northeast Wyoming have to be pleased with early observations. Visual proof of solid numbers of deer populations are also backed by a recent survey by Wyoming Game and Fish biologists and game wardens.
9,328 mule deer and 5,689 white-tailed deer have been located and classified in said region.
The Sheridan Region comprises of Sheridan, Buffalo, Kaycee, Gillette, and Moorcroft. Wyoming primarily at the base of the storied Big Horn Mountains.
Improved precipitation and ample green vegetation associated with abundant rainfall show fawn ratios at an 18% increase from those of 2018. High buck ratios were spotted in most hunting areas indicating a good population of mature deer following the hunting season. Conservative hunting on private hunt areas were identified as a contributing factor to the solid status of mature bucks.
4,061 mule deer were classified in hunt areas 1, 3, 10, 17-19, and 21 which make up Gillette and Moorcroft, Wyoming. Overall, the fawn ratio averaged 63 fawns per 100 does compared to 54 fawns per 100 does in 2018. This year’s buck ratio was 34 bucks per 100 does, down from 45 bucks per 100 does in 2018. The yearling buck ratio was eight per 100 does.
3,344 mule deer were classified in hunt areas 26, 27, 29, 30-33, 163, and 169 which make up Buffalo and Kaycee, Wyoming. Overall the fawn ratio averaged 64 fawns per 100 does, an increase from the 58 fawns per 100 does in 2018. This year’s buck ratios averaged 34 bucks per 100 does, a decrease from 42 bucks in 2018. Even though the ratio was down from last year hunt areas continue to support high buck numbers, including good numbers of mature bucks. The yearling buck ratio was eight per 100 does.
Buffalo wildlife biologist Cheyenne Stewart said, “In general, these populations are fairly stable without remarkable annual fluctuations. There are some longer-term trends in certain areas that are concerning to us, which is why we are investing so much time and energy into targeted research projects such as the Upper Powder River Mule Deer Study initiated in December 2018 and the movement study of mule deer in two herds east of Buffalo initiated in November 2019.”
1,923 mule deer were classified in hunt areas 23 and 24 which make up Sheridan, Wyoming. The fawn ratio was 90 fawns per 100 does, well above the 70 fawns per 100 does observed in 2018. The 45 bucks per 100 does indicate high buck numbers and good numbers of older age bucks in some of the region’s best mule deer habitat. Last year’s buck ratio was 53 bucks per 100 does. The yearling buck ratio was 10 per 100 does.
White-tailed deer numbers are equally solid. 5,689 white-tailed deer were classified in 14 hunt areas in the Sheridan Region. The fawn ratio was 76 fawns per 100 does, whereas the adult buck ratio was 24 bucks per 100 does. The yearling buck ratio was 12 yearling bucks per 100 does.
Winter is generally the time game and fish count herds, for a number of different reasons. This makes an accurate count more realistic from the ground and air. At winter’s end is also a more viable evaluation of the herd. This is because wintertime is the hardest on herds and account for animal deaths.
Game and fish use said surveys to identify herd population trends. And they act as a baseline for licenses issued the following hunting seasons.


